How much SQL can your Text-to-SQL SQL?

The idea of “democratizing data” in enterprise settings has existed for a while. It’s taken different forms over the years such as self-service BI tools, better access to data teams, and more recently, text-to-SQL AI assistants. Still, the core concept has remained consistent: “Your business needs data to operate, and more people in your organization should be able to use it effectively.”
This push for making data useful has driven a lot of improvements:
- BI tools are excellent for analyzing clean, well-structured data.
- A well-maintained data stack keeps data well structured — until scaling outpaces your team’s ability to manage that data.
- There are any number of AI-based tools that claim to democratize data access, which for what it's worth, sometimes do a decent job
But what happens when you need something more than a simple query? For most teams working with raw or incomplete data, getting to a point where tools like BI dashboards and text-to-SQL can shine still requires significant data manipulation and modeling.
This gap — between messy source data and usable, actionable insights — is what we’ll call the presentation layer of your data warehouse. It’s the polished, business-ready version of your data.
The challenge is that most “chat with your data” tools assume this layer already exists. What they’re really offering is “chat with your clean data.” But what we really need is the ability to chat with all data — wherever it is and in whatever shape it’s in.
Let's see what this looks like in practice:
Case Study
Let's say you’re a PM building an enterprise event planning SaaS. You just got out of a meeting with your CEO, where he made a few observations:
- It seems our support ticket volume has ramped up across a few areas of our product
- These might represent friction points that are increasing churn
- We need to take a look at how where these support ticket requests are spiking, how they’re related to feature usage, and how this might affect important accounts.
These are good flags from the boss, but it’s up to us to take a deeper look at the finer details. Let's take a look at the data available to us. How easy this is will depend on the state of our data, lets take a look at four different scenarios.
Level 1: The Promised Land
Welcome to data nirvana. Your data team has done the heavy lifting: clean joins, well-defined metrics, and a pristine presentation layer make your life a breeze. They were able to pull together the exact table you need that neatly includes your accounts, what features they use, and number of support tickets per feature.

In this world, we can just add one helper column to calculate the number of tickets per feature used, that way we know which features are being used most often while still requiring a lot of support. Here, with relatively clean data, a text-to-SQL tool shines, easily generating the below.
SELECT
feature_name,
SUM(num_tickets) AS total_tickets,
SUM(usage) AS total_usage,
CASE
WHEN SUM(usage) > 0 THEN CAST(SUM(num_tickets) AS FLOAT) / SUM(usage)
ELSE NULL
END AS tickets_per_usage
FROM
projection
GROUP BY
feature_name
ORDER BY
tickets_per_usage DESC;
If you have that table handy, you’ll get your answer quite easily! If you haven’t run this query before, we’ll have to do a little more work.

Level 2: It’s not bad, but…
Things aren’t perfect, but they’re manageable. Your team has put effort into getting data into a warehouse and doing basic transformations, so you’re not starting from scratch. However, joins aren’t seamless and your business logic isn’t fully obvious. Shared keys like account_id might not match across all the tables you need.
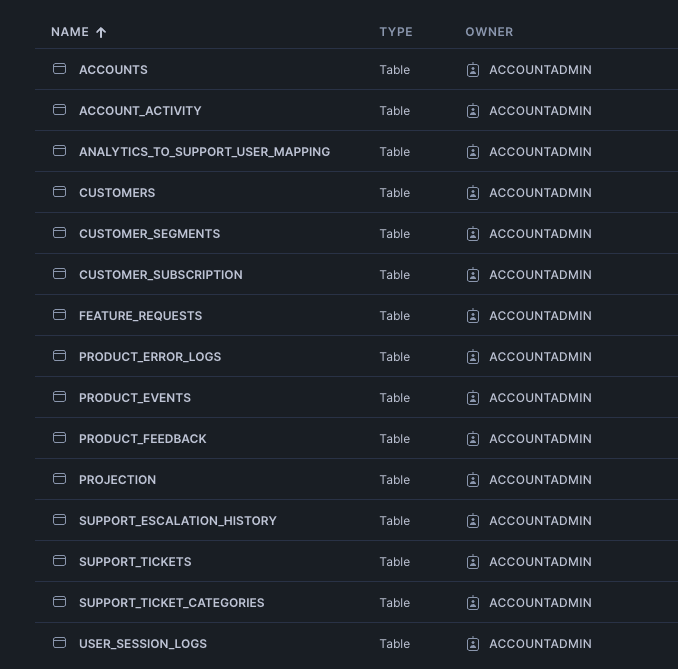
Well first let's start by identifying relevant tables and creating the right joins:
- Support tickets for issues by account and feature
- Product events for feature usage metrics
- Accounts table to link everything together
Let's go ahead and write a query to join these datasets. We can try to get a text-to-SQL tool to help, but it will likely need some cajoling to select the correct columns and identify the right joins. Hopefully, we find something like this.
WITH
-- Subtable for usage calculation
usage_table AS (
SELECT
a.account_name,
product_events.feature_name,
COUNT(product_events.user_id) AS usage
FROM
product_events
JOIN
analytics_to_support_user_mapping ON product_events.user_id = analytics_to_support_user_mapping.user_id
JOIN
customers c ON analytics_to_support_user_mapping.customer_id = c.customer_id
JOIN
accounts a ON c.account_id = a.account_id
GROUP BY
a.account_name, product_events.feature_name
),
-- Subtable for num_tickets calculation
tickets_table AS (
SELECT
a.account_name,
st.feature_name,
COUNT(st.ticket_id) AS num_tickets
FROM
support_tickets st
JOIN
customers c ON st.customer_id = c.customer_id
JOIN
accounts a ON c.account_id = a.account_id
GROUP BY
a.account_name, st.feature_name
)
-- Combine usage and tickets subtables
SELECT
u.account_name,
u.feature_name,
u.usage,
t.num_tickets
FROM
usage_table u
LEFT JOIN
tickets_table t
ON
u.account_name = t.account_name AND u.feature_name = t.feature_name
UNION ALL
SELECT
t.account_name,
t.feature_name,
NULL AS usage,
t.num_tickets
FROM
tickets_table t
LEFT JOIN
usage_table u
ON
t.account_name = u.account_name AND t.feature_name = u.feature_name
WHERE
u.feature_name IS NULL
ORDER BY
account_name, feature_name;
This query is a little more involved, but it results in the clean table in Level 1 that we can easily query and find the answers we need. Still, this situation assumes our data was clean enough to find shared keys and write some clean joins.
Level 3: The struggle is real
Here, you’re working with raw source data from various systems — product analytics, CRMs, and support ticket systems. While you’ve taken basic steps like consolidating data into a warehouse and resolving a few obvious issues, the data is far from analytics-ready. Transforming this messy, siloed data into a usable state requires a lot of work, collaboration, and technical expertise.
Get AstroBee’s stories in your inbox
Join Medium for free to get updates from this writer.
Subscribe
We won’t walk through every step as these would vary depending on where your data is coming from but we’ll call out a few consistent challenges.
First, data arrives in different formats, for example:
- Product Analytics: Event-based JSON logs with fields like user_id, event_name, and timestamp.
- CRM: CSV exports with accounts, users, and customer metadata.
- Support Tickets: Semi-structured data, often with free-text fields for ticket descriptions.
We’ll have to then clean and standardize data across systems:
- Deduplicate Records: Remove duplicate rows in CRMs and event logs.
- Standardize Columns: Rename mismatched fields like acct_id vs. account_id.
We can then start aggregating data into meaningful metrics:
- Create Lookup Tables: Manually map relationships between user IDs and accounts when direct links don’t exist.
- Usage: Group product analytics data by account_id and feature_name to calculate usage totals.
- Tickets: Count support tickets by account_id and feature_name for issue tracking.
This is still a relatively limited list but gives you an idea of some of the steps required to get your data in shape even to begin finding the insights you need. Text-to-SQL unfortunately won’t be able to help with many of these.
Does it have to be this way?
At its core, the challenge of democratizing data boils down to two simple ideas:
- Bring your data together, whatever state it’s in
- Enable everyone to find answers from that source of truth data
Whether you’re working with pristine, analytics-ready data or raw, messy source files, the goal should be to empower teams to access and use data without endless preprocessing.
By bridging the gap between raw data and actionable insights, businesses can truly democratize data and make it a tool for everyone — not just for those with the time and skills to wrestle with it. We’re working on Astrobee to make that vision possible by:
- Dividing the data pipeline into manageable chunks
- Automating each chunk with AI agents
- Enabling your domain experts to provide nuanced context every step along the way, ensuring a shared and accurate source of truth
If that sounds interesting to you, we’d love to chat. Drop us a line at hello@astrobee.ai !